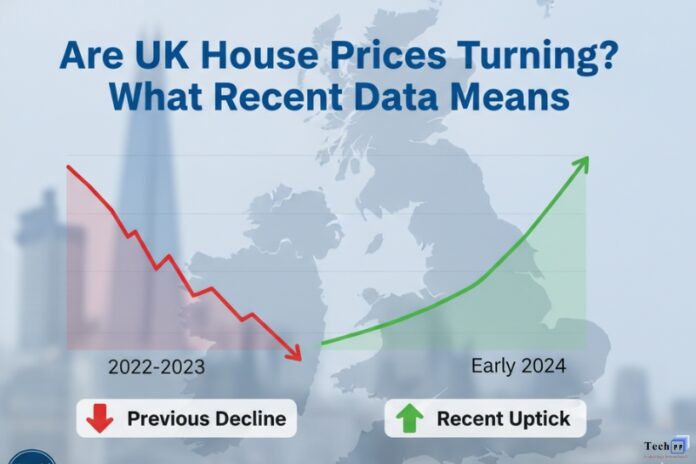
UK House Prices! After a bumpy couple of years, the UK housing market looks steadier, but not uniform. Nationwide’s September 2025 snapshot shows annual growth holding at 2.2% with a 0.5% monthly rise. It’s a sign that activity is ticking along as borrowing costs stabilise.
According to the Office for National Statistics’ most recent release, average UK house prices were up 3.0% in the 12 months to August 2025 (provisional), reaching £273,000. The picture varies by region. The North East led English regions, while London slipped into marginal negative territory on the same measure. This is useful context if you’re comparing neighbourhoods.
What the fresh data says
For a buyer, “2.2% year-on-year” doesn’t mean a surge so much as a market finding its footing. Nationwide also notes approvals hovering around pre-pandemic norms. It suggests you’re competing in a more predictable environment than in 2021–22. Translation: if you’re mortgage-ready, sensible offers have a better chance of landing. And modest month-on-month gains indicate sellers aren’t slashing prices across the board.
The headline average hides big regional splits. ONS’s latest release shows stronger gains outside the South, with London and the South East lagging while northern regions and Northern Ireland lead. For buyers, that means neighbourhood-level due diligence matters more than ever. The same budget can stretch differently just a few postcodes apart, and “soft” regions may offer room to negotiate.
Three quick postcode checks before you decide
You don’t need specialist tools to sense-check a location before shortlisting addresses. These simple lookups help you build a grounded view on prices, connectivity, and everyday practicality.
Local Prices
Start with a house value calculator by postcode to get an instant estimate as a range, not a bullseye. Sold.co.uk’s tool uses an algorithm that draws on 4,000+ data points across your property, postcode and current market movements. If you’re close to making an offer, refine the estimate with a short follow-up conversation. This should help capture details like recent upgrades, condition, street-level quirks.
Connectivity
Poor internet can be a deal-breaker for remote work, gaming, or streaming. Ofcom’s official broadband and mobile coverage checker shows predicted availability and lets you view results on a map. It also flags the Universal Service Obligation if decent broadband isn’t available, which can influence both your offer and renovation plans (e.g., budgeting for alternative solutions).
Schools and catchments
Even if you don’t have children, nearby school performance can shape long-term demand and resale potential. The Department for Education’s school performance checker by postcode lets you compare exam results, view Ofsted reports and see financial information, all in one place. Strong local schools often correlate with tighter supply and firmer pricing. Weaker results can mean more negotiating leverage.
The national averages suggest a gentle turn rather than a surge. What matters most is postcode-level reality. This includes recent selling prices, credible broadband options, and everyday factors like school catchments. Combine the latest ONS and Nationwide signals with quick local checks, and you’ll make a more confident call on where value really lies.


